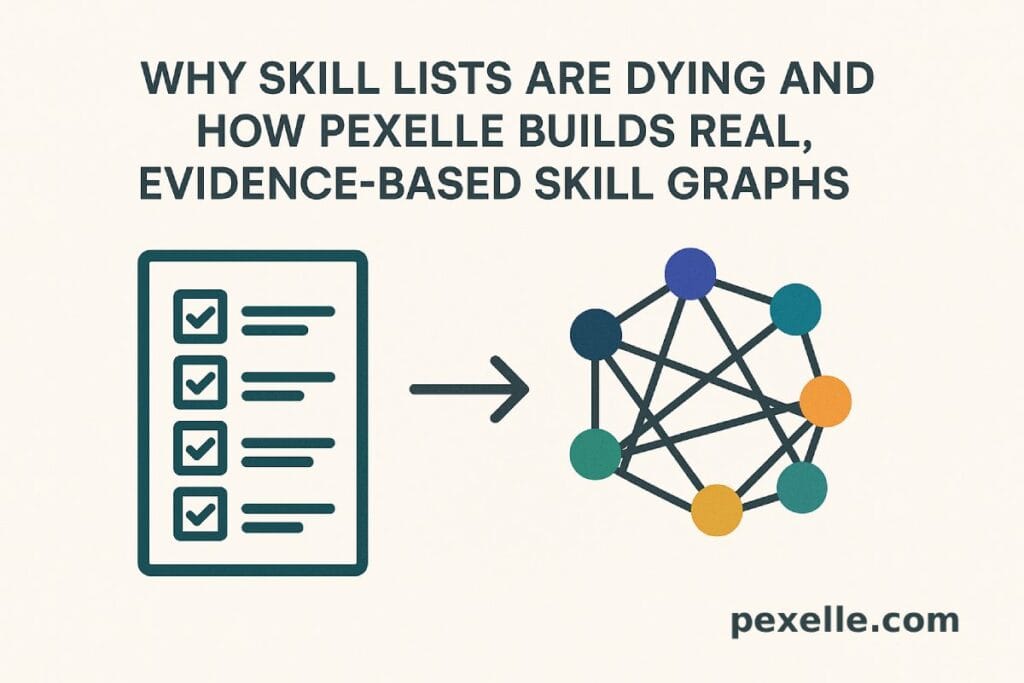
Skill Graphs: Why Skill Lists Are Dying And How Pexelle Builds Real, Evidence-Based Skill Graphs

The shift from static skill lists to dynamic, interconnected capability graphs in 2025
1. The Problem With Traditional Skill Lists
For years, platforms like LinkedIn relied on flat skill lists: a user adds “Python,” “Teamwork,” or “Cloud Computing,” and the system treats all skills as equal, independent items.
But this model is broken:
- Skills don’t exist in isolation
- They don’t reflect depth, context, or progression
- They can be faked with a click
- They fail to show how skills interact in real work
- They can’t be properly scored or validated
A static list is just noise in 2025.
2. The Global Shift Toward Skill Graphs
Major platforms—LinkedIn, Indeed, Degreed, Coursera, and internal HR systems—are abandoning lists and moving toward Skill Graphs.
A Skill Graph connects:
- Core skills
- Sub-skills / micro-skills
- Projects
- Learning pathways
- Tools & technologies
- Related competencies
- Real-world applications
- Evidence links
- Performance signals
Instead of a list, you get a network of interconnected skills that evolves with your experience.
3. What a Skill Graph Actually Represents
A Skill Graph shows:
- what you know
- how deep that knowledge is
- how the skills combine
- where you learned them
- how you applied them
- what evidence backs them
- how they improved over time
- how they relate to jobs or industries
It’s the difference between saying “I know React” and proving:
- I learned JavaScript from source X
- I built Y project using React
- I connected React with Node in a real system
- I used Redux for state
- I deployed it on AWS
- I repaired bugs and handled performance issues
That’s a graph — not a keyword.
4. Why Skill Graphs Are Essential in 2025
Companies no longer look for a single skill.
They look for skill combinations:
- Python → Pandas → SQL → Data Viz
- React → TypeScript → Next.js → API Integration
- AI → Prompt Engineering → Evaluation → Safety
- DevOps → Docker → CI/CD → Cloud
These combinations form capability clusters—something a simple skill list cannot capture.
Skill Graphs reveal:
- actual job readiness
- depth vs. breadth
- complementary strengths
- hidden expertise
- growth over time
This is why hiring systems are switching to graph-based matching.
5. The Role of AI in Skill Graph Construction
AI models now:
- infer missing skills
- detect related competencies
- validate connections through evidence
- identify gaps
- estimate skill depth
- link skills to job requirements
But AI requires structured, evidence-rich skill data.
This is the part traditional platforms fail at.
6. How Pexelle Builds Evidence-Based Skill Graphs
Unlike other platforms, Pexelle doesn’t let users manually “add” skills.
Pexelle constructs skill graphs from real events.
Here’s how:
✔ 1. Skill Origins
Pexelle identifies where each skill started:
- learning sources
- courses
- mentor sessions
- hands-on practice events
Each origin event becomes a graph node.
✔ 2. Micro-Skill Events
Every small capability demonstration commit, pull request, task output, challenge, assessment—is captured.
These events strengthen or weaken graph connections.
✔ 3. Project-Level Linking
When you complete a project, Pexelle:
- extracts the skills involved
- scores their complexity
- maps relationships between skills
- identifies toolchains and workflows
- measures contribution depth
A project enriches multiple nodes, creating a dense, accurate graph.
✔ 4. AI-Evaluated Proof
Pexelle’s AI models evaluate:
- originality
- technical accuracy
- difficulty
- skill overlap
- application depth
Results feed directly into your graph with weighted edges.
✔ 5. Time-Based Progression
Skills are not static; they decay or grow.
Pexelle tracks:
- skill freshness
- recency of practice
- performance improvements
- consistency of usage
This creates a temporal skill graph, not a snapshot.
✔ 6. Evidence Attachments
Nodes and edges link to real evidence:
- commits
- reports
- code snippets
- diagrams
- deployments
- challenge results
- design artifacts
- datasets
- evaluations
This makes every part of the graph auditable.
7. Scoring the Skill Graph: How Pexelle Computes Real Capability
Pexelle uses multi-layer scoring:
A) Node Score (Skill Strength)
Based on:
- total evidence
- difficulty
- recency
- self-learning vs. applied work
- verification quality
- project impact
B) Edge Score (Skill Relationship Strength)
Based on:
- frequency of co-occurrence
- sequence of usage
- dependency patterns in projects
- AI-inferred logic between skills
C) Graph Cohesion Score (Capability Clusters)
Measures how strongly skills connect into job-ready clusters (e.g., Data Analyst Stack, Frontend Stack, AI Safety Stack).
Employers love this because they can see complete skill ecosystems, not random skills.
8. Why Skill Graphs Are More Fair Than Skill Lists
Traditional lists reward:
- loud candidates
- inflated claims
- people with long job titles
- those who write better summaries
Skill Graphs reward evidence, not confidence.
This levels the field for:
- juniors
- immigrants
- self-taught professionals
- career switchers
Evidence-based graphs are meritocratic.
9. The Impact on Hiring
Skill Graphs power:
- AI-based candidate matching
- job readiness scoring
- skill gap analysis
- career mobility prediction
- personalized learning paths
- verified competency mapping
Companies hire faster and more accurately because they don’t guess—they see the skill network.
10. Conclusion: Skill Graphs Are the Future and Pexelle Is Building Them the Right Way
Skill lists are dead because they hide the truth.
Skill graphs reveal:
- depth
- context
- relationships
- evidence
- evolution
- capability clusters
Pexelle takes this to the next level by building evidence-driven, AI-verified, dynamically scored Skill Graphs instead of static lists.
This is the future of skills and Pexelle is already delivering it.
Source : Medium.com


